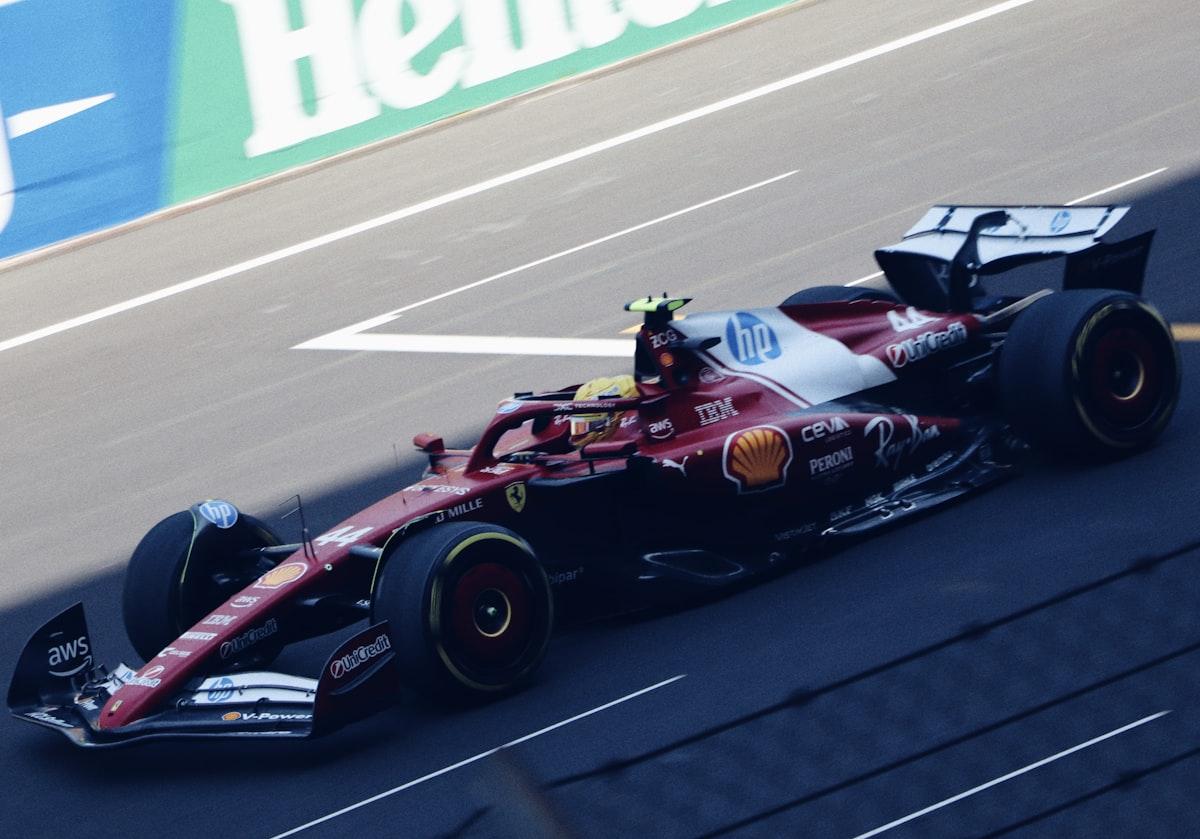
Madrid’s pit lane has become a focus of debate around the new Spanish Grand Prix circuit. But when assessing its effect on strategy, two different measurements need separating: how long a car spends making its pit visit, and how much time that visit costs against a rival who stays on track.
The second number is what determines whether a driver can stop and keep a position. A car can spend 30 seconds taking the pit route without losing 30 seconds to its opponent, because that opponent also needs time to cover the corresponding section of circuit.
That distinction helps explain why the length of a pit lane matters without, on its own, settling whether an extra stop is worthwhile. The tyre advantage afterwards, the traffic at the exit and the remaining laps all enter the calculation.
Three different clocks behind one pit stop
The most visible clock measures the stationary stop: the period when the car is stopped at its garage while the mechanics work.
The pit-lane elapsed time covers a wider interval between specified timing points. It includes travel through the lane as well as the stationary service. When comparing published figures, check where those timing points are.
Then there is net pit-stop loss: the extra time required to take the pit route instead of continuing around the circuit.
These measurements answer different questions. The stationary time helps assess the service. The elapsed time describes the visit. The net loss helps assess the strategic cost.
F1’s explanation of its speed limits says the standard 2026 limit is 80km/h, with reductions at selected events for safety. The limit applies between designated entry and exit lines. That makes the length of the restricted section relevant to the time spent travelling through it.
Source: https://www.formula1.com/en/latest/article/explained-why-are-there-pit-lane-speed-limits-in-f1-and-how-are-they-measured.jc4jiWVsfbRhb62QomSf0
A worked example: 30 seconds in the pits, 22 seconds lost
Consider an illustrative circuit. These are deliberately hypothetical figures, not measured Madrid data.
A driver takes 30 seconds to travel from a chosen reference point before pit entry to another after rejoining, including the tyre change.
A comparable driver staying on the racing surface takes eight seconds between those same reference points.
The additional cost of stopping is:
30 seconds − eight seconds = 22 seconds.
If the first driver had been 24 seconds ahead, that simplified calculation suggests a two-second margin after the stop.
It does not guarantee the position. A slow service, cold tyres or another car approaching the exit could consume that margin. The example assumes comparable pace and unchanged conditions.
This is why subtracting an entire pit-lane timing figure from the gap on television can produce the wrong prediction. The comparison must account for both routes.
What makes the Madrid debate relevant?
Before the race, Pirelli selected its C2, C3 and C4 compounds for Madrid. Its July announcement said the selection aimed to favour a two-stop strategy while addressing the expected tyre loads and overheating risk. That was a planning expectation, rather than a promise about how the race would unfold.
Source: https://press.pirelli.com/tyre-compounds-selected-for-zandvoort-monza-and-madrid/
Formula 1’s September preview, meanwhile, listed pit-stop time loss as unavailable. It discussed the new surface and the work undertaken to model the circuit’s tyre demands. A pre-event estimate therefore needs to be distinguished from a measured race outcome.
Source: https://www.formula1.com/en/latest/article/need-to-know-the-most-important-facts-stats-and-trivia-ahead-of-the-2026-spanish-grand-prix-madrid-madring.0VbYQHCnrBCibxbkwygP0
The underlying strategic question is straightforward: how much faster must fresh tyres make the car to repay an additional visit?
A longer visit increases that repayment requirement, all else being equal. It does not tell us whether the driver can actually deliver the required pace.
How much faster must new tyres be?
Return to the hypothetical 22-second loss.
With 20 racing laps remaining, an extra stop would require an average gain of 1.1 seconds per lap merely to recover those 22 seconds.
With ten laps remaining, the required average becomes 2.2 seconds per lap.
Neither calculation includes the difficulty of passing another car. Nor does it assume the advantage stays constant: tyres change in performance during a stint.
The arithmetic is useful because it makes a strategy claim testable. Instead of saying that fresh tyres “should be much quicker”, ask how much quicker, for how long, and under which conditions.
A promising first lap after the stop is insufficient evidence. The driver needs to earn back the cost across the remaining distance.
Why traffic changes the calculation
Imagine the fresh tyres could produce a strong advantage in clear air, but the driver rejoins behind a slower car.
The potential lap time is now different from the lap time available in that position. If passing takes several laps, part of the remaining distance disappears before the new tyres can deliver their full benefit.
This is also why a strategy that looks quicker in an unobstructed calculation can be less attractive in a race.
An extra stop exchanges current track position for a future opportunity. The opportunity needs to be large enough, and accessible enough, to justify the exchange.
For viewers, the relevant gap is therefore not only the gap to the car directly ahead. Look at the group around the projected rejoining position.
Leclerc’s race shows why the running order can mislead
Charles Leclerc led 32 of Madrid’s 57 laps but finished fourth. Formula 1 reported that Ferrari kept him out while hoping for a late Safety Car, then stopped him on lap 48 as George Russell approached his pit window.
Leclerc defended the approach, saying he would choose the same strategy again. His explanation was that a late interruption could have created an opportunity that the alternative tyre sequence would not.
Source: https://www.formula1.com/en/latest/article/we-did-the-right-thing-leclerc-reflects-on-ferraris-strategy-in-spanish-grand-prix.5j2upQDTZCFn8vAD3oj2Hh
That example separates leading on the road from leading after outstanding stops are accounted for. A driver’s displayed position does not show the cost of a visit still to come.
It also cautions against judging a decision solely by whether the hoped-for event happened. Assess the options available at the time, then the outcome.
What happens next?
The most useful follow-up would compare actual pit visits using consistent timing boundaries, race conditions and stationary-service times.
Any assessment of a proposed Madrid layout change should then ask how it alters the net cost of stopping. Removing distance from the pit route could matter, but the racing route used for comparison matters too.
For the next race, watch three things together: the gap before the stop, the position at the exit, and the pace over the following laps. Those observations give a much stronger basis for judging strategy than the tyre-change stopwatch alone.